Skip to main content
Charts
A person working at a computer in a modern office
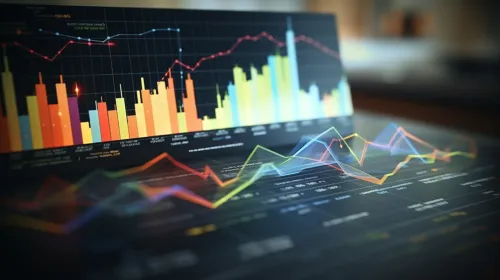
Data Analysis: Graphs and Charts
Financial Expert Monitoring Charts
Medical Professional with a Tablet and Charts
Animated Financial Analyst Against a Background of Graphs
Cute character in an office setting with graphs
Dynamics of the Financial Market in an Urban Atmosphere
Visitor in front of a digital display of data
Here you may place your ADS.
Modern Laptop with Graphs and Data
Workspace with a Laptop and a Drink
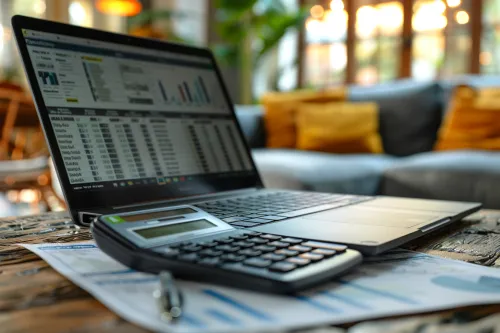
Workspace with a Laptop and Calculator
Abstract Digital Image in Red Tones
Abstract Landscape with Golden and Black Tones
The Modern Analyst in the Digital World
Data Analysis in the Modern Office