Skip to main content
Diagrams
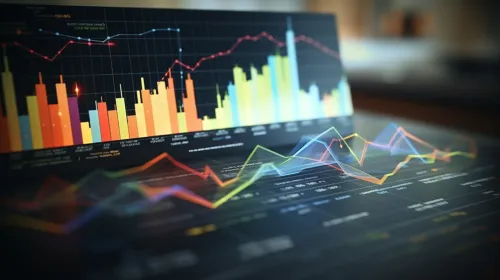
Data Analysis: Graphs and Charts
Cute character in an office setting with graphs
Visitor in front of a digital display of data