Skip to main content
Financial Charts
Animated Character with Data and Graphs
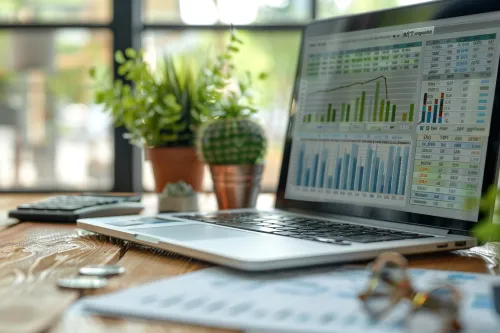
Workspace with a Laptop and Plants
The Harmony of Business and Technology