Home
GetPic

User account menu

  • Log in
  • English
  • Russian
  • Испанский

Diving into the World of Indicators

Welcome to the collection dedicated to indicators — important tools that play a key role in various areas of our lives. Indicators help us see and understand information in a structured way, whether it’s financial charts, environmental measurements, or performance assessments.

In this collection, you will find a variety of images showcasing different types of indicators used in science, economics, manufacturing, and even everyday life. These can include graphs and charts displaying economic trends and budget figures, or sensors that record changes in the environment, such as air pollution levels or temperatures.

Each image of indicators is presented in high quality, allowing for a detailed examination of their components and designs. You may encounter:

  • Economic Indicators: graphs and tables with data on GDP, inflation, and unemployment, which help analyze the financial activity of countries and regions.
  • Scientific Indicators: various instruments and devices, such as thermometers, barometers, and other measuring tools used to observe natural processes.
  • Production Indicators: control panels and automated devices showing system status, production levels, and process efficiency.

These indicators serve not only for data collection but also for decision-making, planning, and forecasting. With their help, we can better understand changes in the surrounding world, summarizing and evaluating risks. Each indicator is unique and has its own story to tell, increasing awareness and deepening understanding of processes. Follow our collection to discover the world of indicators and their significance in everyday life.

Indicators

Control panel with measuring instruments and indicators in the factory
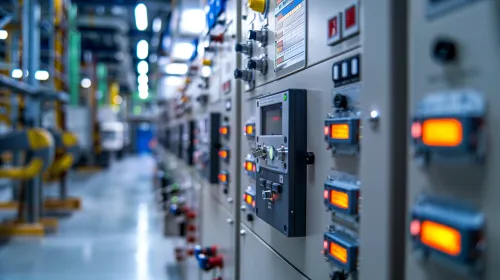
Modern Electrical Equipment in the Factory
Control panel with buttons and indicators in a factory environment
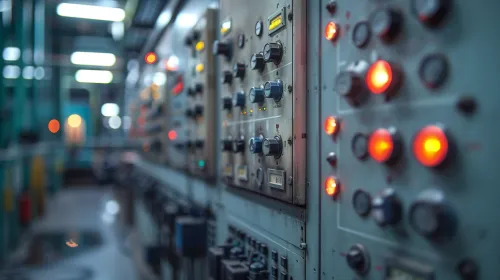
Control Panel of Industrial Equipment