Home
GetPic

User account menu

  • Log in
  • English
  • Russian
  • Испанский

Welcome to the world of scientific visualization, a unique field that transforms complex data and concepts into clear, interactive, and accessible representations. If you're looking for images showcasing the power and beauty of scientific visualization, you've come to the right place. Our collection offers a wide range of high-quality illustrations and graphs that will help you gain a deeper understanding of the various aspects of science and technology.

Scientific visualization encompasses numerous subjects, from molecular structures and celestial bodies to ecological processes and medical research. You will find images that display 3D models of molecules, allowing you to examine their internal structure and interactions at the atomic level. Graphs illustrating climate models and their changes are also included, helping to perceive the dynamics of the environment and its impact on Earth.

Each representation in our collection has been created with the aim of conveying complex scientific ideas to a broad audience in the simplest and most understandable way. Here, you can see visualizations of data distributions, including charts and graphs that aid in simplifying the analysis of statistical information. Detailed maps presented in our collection demonstrate geographical data and help viewers better understand patterns and trends in resource and population distribution.

Equipped with modern technologies such as computer graphics and virtual reality, our images allow you to immerse yourself in the world of science, discovering new opportunities for research and discoveries. From digital modeling of cells and organs to visualizing complex physical phenomena, such as turbulence in fluids or vibrations in solids, you will be able to explore the full richness of scientific visualization.

Explore our collection and unleash your imagination as you discover new horizons of knowledge through the visual representation of scientific data!

Scientific Visualization
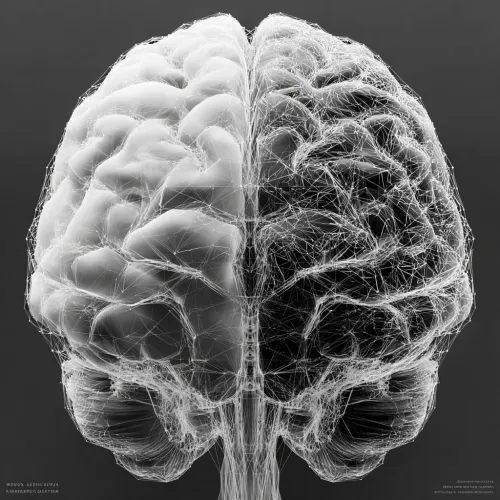
Production of Molecules with Golden Drops in Abstract Composition
Abstract Molecules with Drops of Liquid
Molecules and droplets of liquid in golden and yellow tones at the microscopic level
Microscopic Structure of Molecules in Yellow Color
Original image of molecular structures with abstract shapes and colors
Abstract Visualizations of Molecular Structures
Person examining an interactive screen with graphs and data
Visitor in front of a digital display of data
Dynamic image of a lava explosion with flying stones in space
Volcanic Energy: Lava and Stone Eruption
Dynamic image showing the contrast between fire and ice
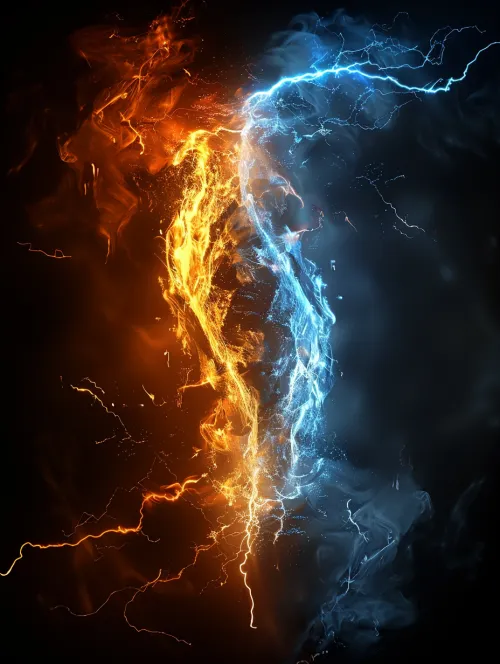
Visualization of the Rivalry Between Fire and Ice
Scientific visualization of a black hole surrounded by a glowing gas cloud
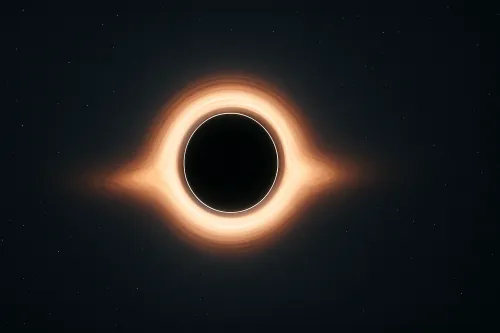
Image of a Black Hole in Space
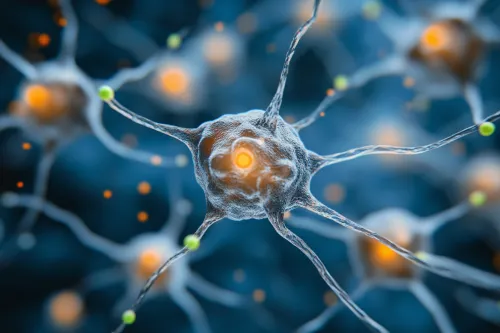
Microscopic Image of a Neuron