Home
GetPic

User account menu

  • Log in
  • English
  • Russian
  • Испанский

Welcome to the collection of images dedicated to scientific visualizations! If you want to dive into the exciting world of conveying information about complex scientific data, you're in the right place. Here, you will find a variety of visualizations that allow you to understand and analyze data from different fields of science, from physics and biology to astronomy and medicine.

Scientific visualizations can include graphs, charts, models, and 3D images that illustrate research results and trends. These images help to effectively present quantitative data, visualize chemical reactions, demonstrate anatomical structures, and even show the movements of celestial bodies. They are an important tool for educational and research purposes, facilitating a deeper understanding and analysis of complex concepts.

Our collection features visualizations that display microscopic and macroscopic processes, allowing for the exploration of phenomena that are difficult to see with the naked eye. You'll find images representing atomic structures, ecosystems, cosmic objects, and climate changes, each of which reveals fascinating aspects of science.

These visualizations not only serve as educational material for students and teachers but also help professionals present their results at conferences and seminars. You will see how complex phenomena are transformed into accessible and easily perceived images that make science more understandable and accessible to a wide audience.

We invite you to explore our collection of scientific visualizations that open doors to the amazing world of science and technology, showcasing their richness and diversity through visual images that foster learning and inspiration.

Scientific Visualizations

Map of the world illuminated by city lights against a dark cosmos
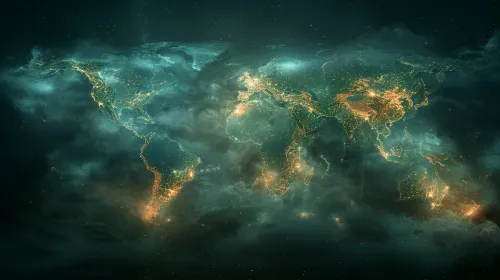
Lights of the World Against a Starry Sky