Skip to main content
Visualization
San Francisco Model with Golden Gate
Data Analysis: Graphs and Charts
Cosmic Landscape with Celestial Clouds
Icons of Houses and Architectural Design
Natural Stone Texture with Wavy Pattern
Energy in Shades of Red and Black
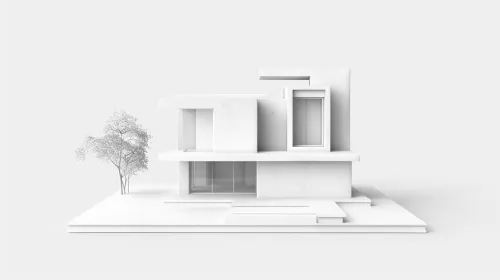
Minimalist House Model on Background
Modern Minimalist House with Greenery
Here you may place your ADS.
Model of Industrial Objects in Minimalistic Style
Earth from Space at Dawn