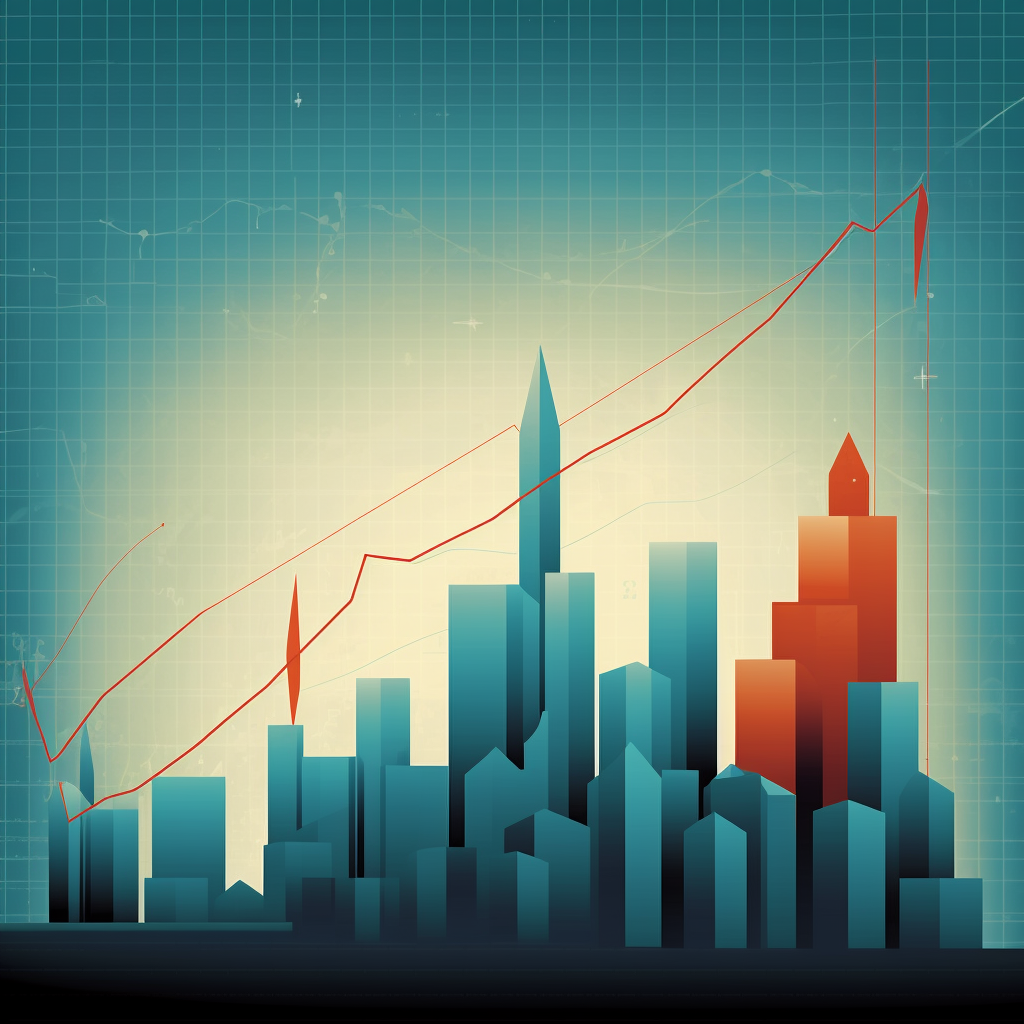
Urban Landscape Growth Chart
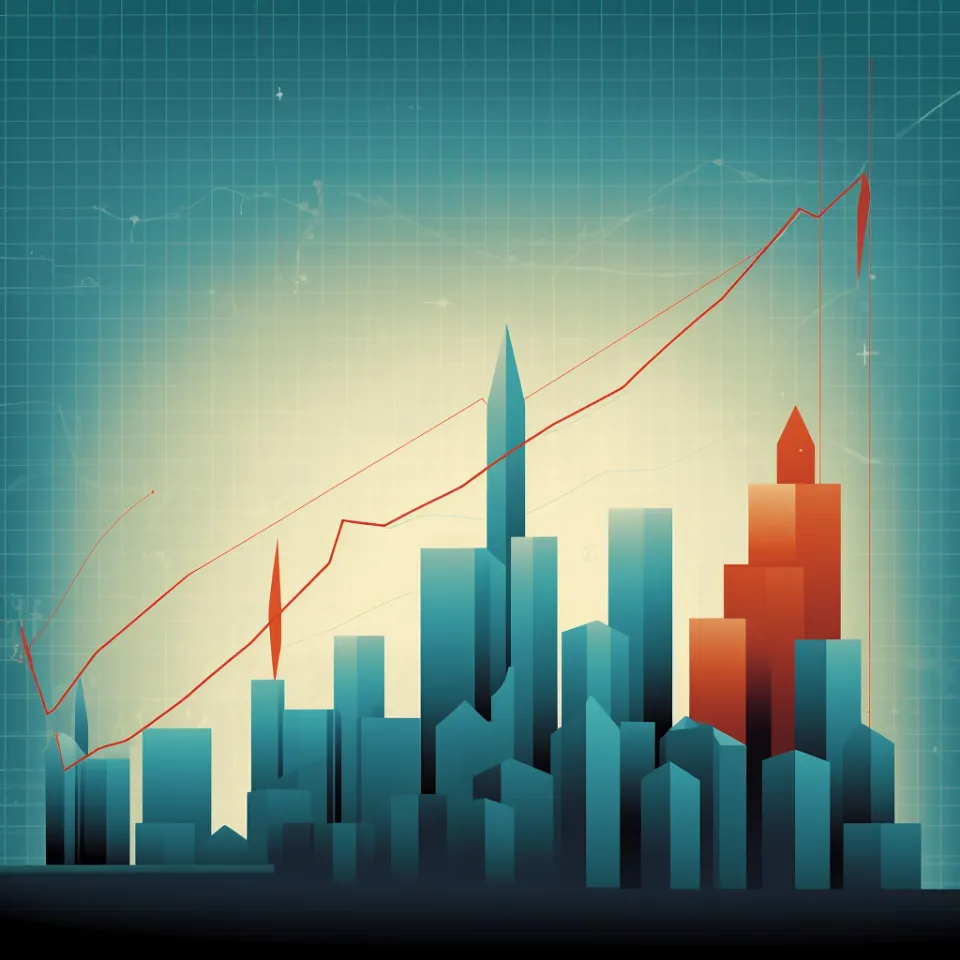
The image features a stylized urban landscape, where buildings of various heights and shapes are depicted isometrically. The background has a gradient transition from light to dark blue, creating a sense of depth. In the foreground, a red chart rises upwards, symbolizing growth and development. The line of the chart has a wavy shape, which may indicate fluctuations in the data. Each element of the city is rendered in soft shades of blue, standing out against the background.
This style of image can be used as a visual representation of economic trends or business reports. The graphic element makes it easy to understand growth-related information, linking it to an urban atmosphere.
This image can be used in various fields, such as business, economics, marketing, and analytics. It is perfect for illustrating articles related to financial growth and can also serve as a background for presentations and data visualizations. The stylized urban landscape helps create an appealing appearance that will engage the audience and draw attention to important information.
Additionally, it can be used in educational materials or seminars related to entrepreneurship and business strategies. Visual elements facilitate comprehension and retention of information.


