Skip to main content
Data Analysis
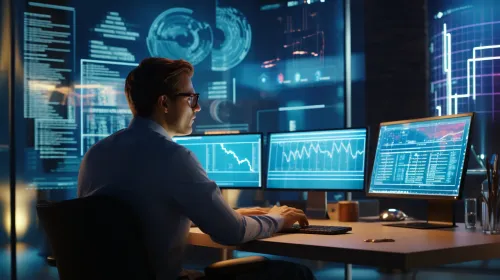
Data Analysis in a High-Tech Modern Office
Here you may place your ADS.
A person working at a computer in a modern office
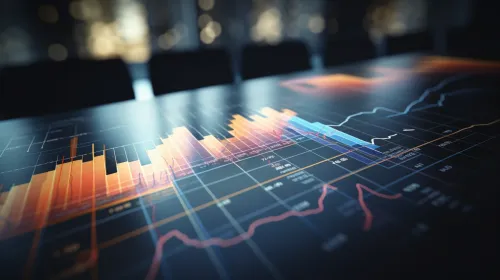
Financial Analysis Data on a Digital Graph
Scientist at Work in the Laboratory
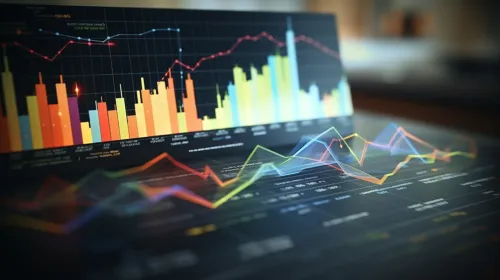
Data Analysis: Graphs and Charts
Financial Expert Monitoring Charts
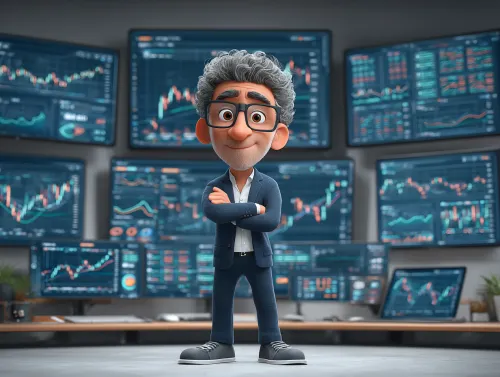
Animated Financial Analyst Against a Background of Graphs
Cute character in an office setting with graphs
Dynamics of the Financial Market in an Urban Atmosphere
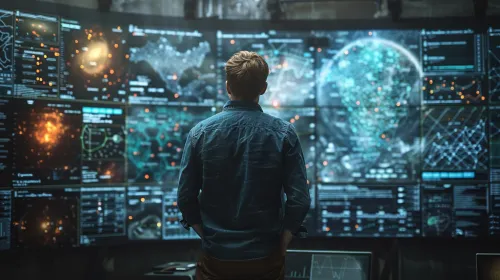
Visitor in front of a digital display of data
Data Analysis Specialist Against the Background of an Information Screen
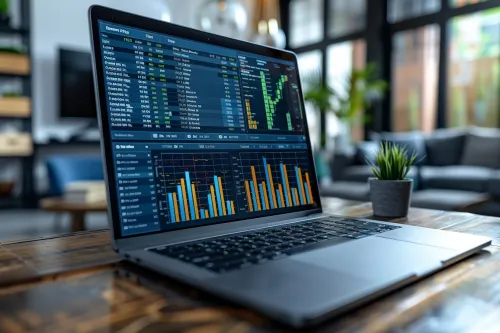
Modern Laptop with Graphs and Data
Woman in a Technological Environment with Data
Abstract Digital Landscape with Data and Networks
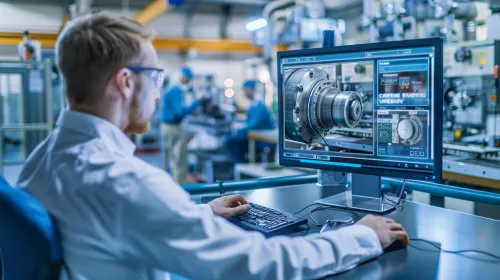
Engineer at a Computer in a Manufacturing Facility
The Modern Analyst in the Digital World
Technological Data Analysis
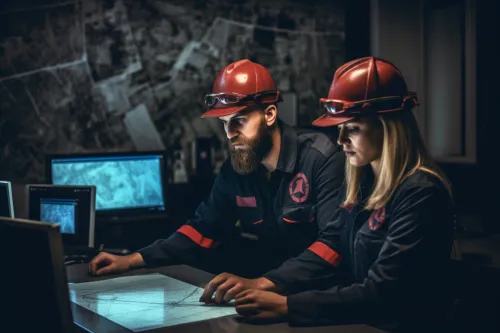
Employees at a Production Meeting
The Harmony of Business and Technology