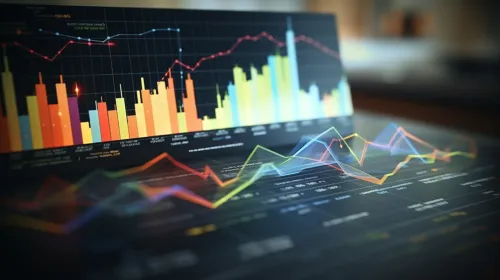
Financial Analysis Data on a Digital Graph
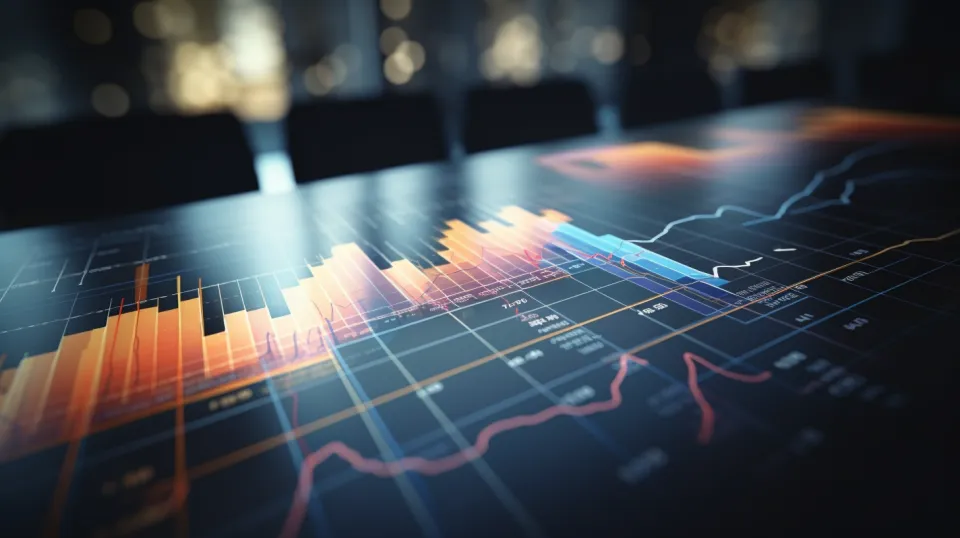
The image features a modern chart displaying financial data. The chart is designed in dark tones, with bright colorful elements that highlight different levels and trends. It showcases both bar and line graphs that represent changes in indicators over a certain period. The use of various color schemes helps emphasize key moments, such as highs and lows. The graph is placed on a table surface, adding realism and creating a sense of a workspace. The blurred background emphasizes the focus on the chart itself, creating a depth effect.
The image can be used in various contexts related to finance and analytics. It is suitable for illustrating articles on economics, financial reports, presentations, and educational materials on data analysis. The graph can capture the audience's attention and help better understand complex financial concepts. Additionally, it can be used for data visualization in corporate reports or websites related to investments and analytics, making it a versatile tool for business professionals.


